One Config Change Cut Our Inference Cost 4.8×
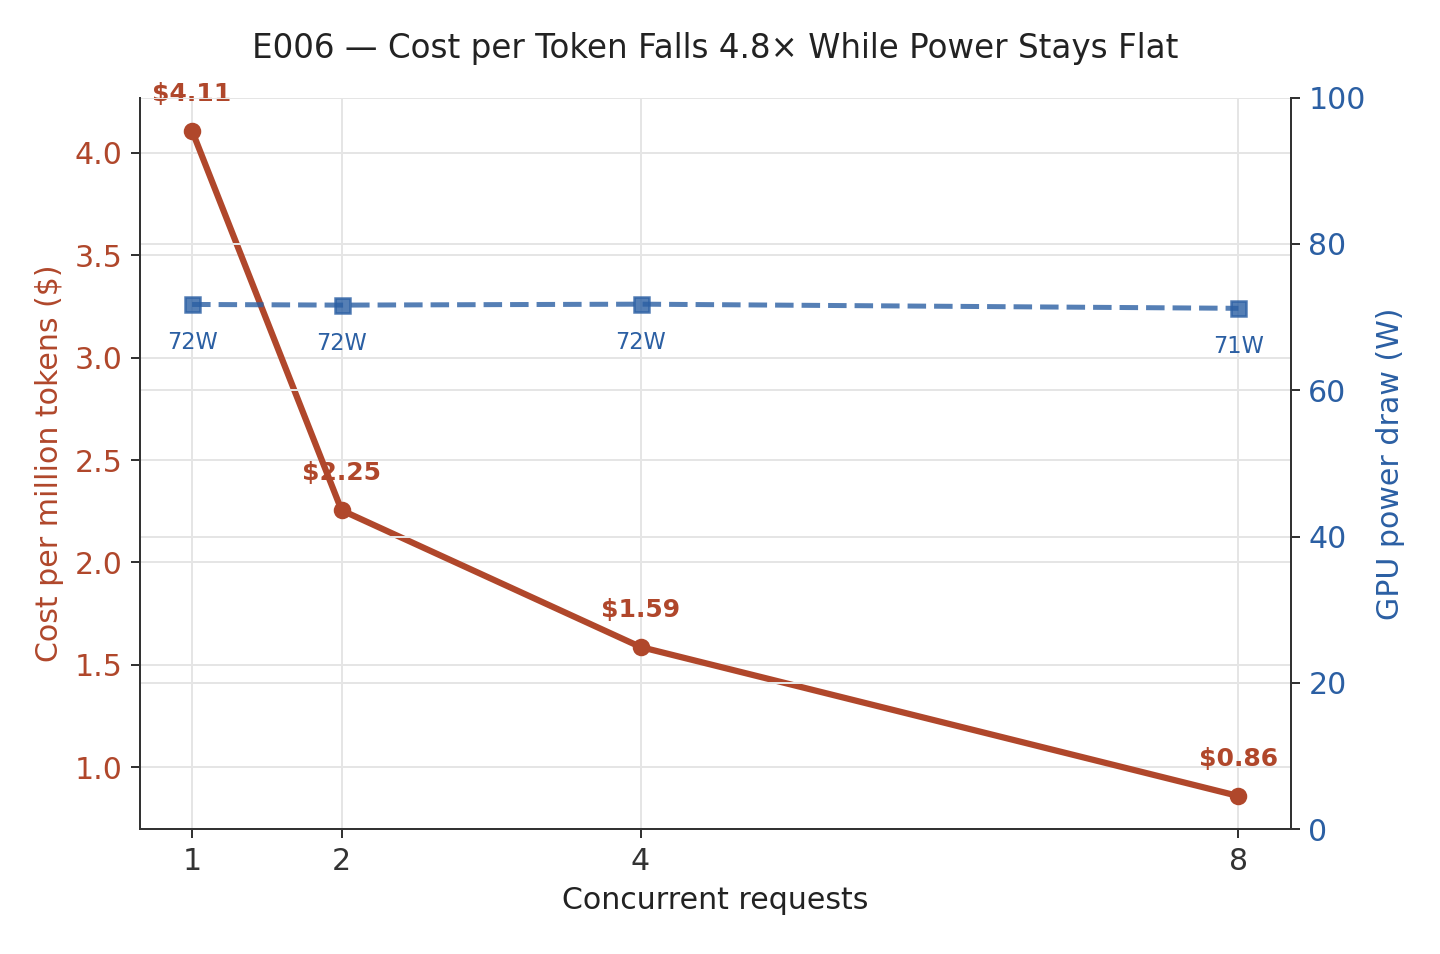
No new hardware. No model change. No infrastructure migration. One configuration setting — how many requests we let the GPU process at the same time — and the cost of generating a token dropped by nearly 80%.
This is a standalone deep-dive into a single experiment (E006) from our private LLM infrastructure series. If you're running self-hosted inference and looking at a GPU utilization dashboard that already looks "busy," this is the one result in the series most likely to change what you do next.
The number that made this look like a dead end
We'd already benchmarked this exact deployment — an 8B parameter model on an NVIDIA L4 GPU — running one request at a time, back-to-back. GPU utilization came back at 95.93%. Read at face value, that's a GPU with almost nothing left to give. If you were deciding whether it's worth the engineering time to add request batching, "already at 96% utilization" looks like a reason to stop and look elsewhere.
We tested it anyway.
What we changed
We reran the same deployment at four levels of concurrency — the number of requests the server processes at the same time, rather than strictly one after another — while everything else stayed identical: same model, same prompt, same GPU, same hardware.
| Concurrency | Cost per million tokens | GPU power | GPU utilization | Aggregate throughput |
|---|---|---|---|---|
| 1 | $4.11 | 71.7 W | 96.1% | 48.0 tok/s |
| 2 | $2.26 | 71.6 W | 93.5% | 87.4 tok/s |
| 4 | $1.59 | 71.8 W | 90.9% | 124.2 tok/s |
| 8 | $0.86 | 71.2 W | 84.3% | 229.4 tok/s |
Cost per token fell steadily across every step, with no sign of leveling off by the time we stopped at 8 concurrent requests. Every repetition of every condition landed within about 1% of its pair — this is the tightest reproducibility we've measured anywhere in the series, so this isn't noise.
The part worth sitting with: GPU utilization went down slightly as concurrency went up, from 96.1% to 84.3%, while real cost efficiency improved by 4.8×. The metric that looked like "we're already maxed out" moved in the opposite direction from actual efficiency.
Why utilization lied
GPU power draw stayed essentially flat — about 71 watts — regardless of whether one request or eight were being processed simultaneously. Since cost per token is a function of power divided by throughput, and power barely moved, the entire cost improvement came from throughput alone: aggregate output scaled from 48 to 229 tokens per second, a 4.78× increase, on the same power draw.
Our best explanation: single-request decoding on this GPU was spending a lot of its "active" time waiting on memory rather than actually computing — a memory-bandwidth-bound workload, in the terminology. A utilization reading counts that waiting time as "busy" the same as it counts genuine compute work; it doesn't distinguish between the two. Batching multiple requests together let the GPU's otherwise-idle compute cycles do useful work for a different request's tokens, while memory movement — the actual bottleneck — got amortized across more simultaneous output.
We want to be precise about what we did and didn't establish here: this is the interpretation the data is consistent with, not a mechanism we isolated directly — we didn't profile the GPU at the kernel level to confirm the bandwidth bottleneck itself. What we measured directly, and repeatedly, is the outcome: flat power, rising throughput, falling cost, even as utilization nominally declined.
Latency didn't stay free — but it stayed cheap
Concurrency isn't a pure win with no tradeoff. Per-request latency rose as more requests shared the GPU — mean latency nearly doubled from 12.9 seconds at concurrency 1 to 21.2 seconds at concurrency 8, and time-to-first-token more than doubled (0.075s → 0.163s).
Both numbers stayed small in absolute terms — under a quarter-second to first token, under 25 seconds for a full response, even at the highest concurrency tested. Whether that tradeoff is acceptable depends entirely on what you're building: a real-time chat interface has a much lower latency ceiling than a batch summarization job. But for most workloads that aren't latency-critical to the second, a modest, bounded latency increase in exchange for a 4.8× cost reduction is not a close call.
What this means if you're running self-hosted inference
Before you provision more GPUs, check whether you're actually batching requests. If your deployment processes one request at a time by default — which is the out-of-the-box behavior for a lot of simple setups — you may be paying several times more per token than the same hardware could deliver with concurrency turned on.
Stop reading utilization as a headroom gauge on its own. It tells you whether the GPU is doing something right now. It does not tell you whether that something is using the hardware well. On a workload like this one, a utilization number that looks saturated can sit directly on top of a large, unclaimed efficiency gain.
Check your inference server's parallel-request configuration explicitly. In our case, this required confirming a specific setting (OLLAMA_NUM_PARALLEL) was set before concurrent requests would actually execute in parallel rather than queueing behind each other server-side — a silent queue would have looked identical to genuine concurrency from the client side, without delivering any of the benefit. We verified genuine overlap directly rather than assuming it from the config value alone.
Match the concurrency level to your actual traffic, not the benchmark ceiling. We stopped at 8 because that's where this test was scoped, not because 8 is a universal right answer — and cost was still falling with no plateau in sight at that point. If your traffic pattern can sustain higher concurrency, it's worth testing further before assuming 8 is close to optimal.
What's still open
Cost was still falling at concurrency=8 with no sign of leveling off — we don't know where, or whether, it plateaus at 16 or 32 concurrent requests. That's the natural next test, not a gap in this one: the design here intentionally didn't chase a higher ceiling without a specific reason to, and "still improving, no plateau" is exactly the reason that showed up.
This result is also scoped to one model, one GPU, one cloud pricing snapshot, and a workload run to saturation rather than a realistic bursty traffic pattern. Whether the same magnitude of improvement holds for a different model size or a traffic pattern with real idle periods is a different question than the one this experiment answered.
Where this fits
This is one piece of a six-experiment series testing what private LLM inference actually costs, in practice rather than on a spec sheet — including a separate finding that bigger GPUs aren't automatically more efficient, and that GPU-only power readings can misstate whole-system cost entirely. The full synthesis is in The Metric That Kept Lying to Us.
Related reading: We Tested This Finding on a Second Model — It Held · Why We Didn't Upgrade to the Bigger GPU · Build vs. Buy for Private LLM Inference
If you're trying to figure out what your own deployment's concurrency ceiling actually is, or whether your infrastructure spend matches what the hardware can really deliver, book a call — this is exactly the kind of question worth measuring rather than guessing at.