The Metric That Kept Lying to Us: Six Experiments in Private LLM Infrastructure
If you're deciding how to run an AI model privately — on your own hardware or a cloud GPU you control, instead of paying per API call — you will eventually face a version of this question: how much does a token actually cost us, and what should we change to make it cheaper?
That question sounds like it has a straightforward answer. Look at your GPU's power draw, look at its utilization graph, do the division. We ran six experiments expecting to arrive at that answer. Instead we found that four different numbers — each one real, each one correctly measured — each pointed to a wrong conclusion, because each one was only looking at part of the system.
This article walks through what we tested, what we initially believed, what we found when we looked closer, and what each reversal means if you're the person deciding what hardware to buy, what to measure, or whether to trust the dashboard in front of you.
The central idea, stated up front: a technically correct metric can still lead to a technically wrong decision, if it's only measuring part of the system.
Setting the baseline: trust nothing until you've checked it
What we tested: A small model (llama3.2:3b) on a laptop GPU, sampled roughly once per second for 40 minutes, to establish a clean baseline before testing anything more complex.
What initially appeared to be true: The raw data logging showed apparent problems — 30 rows with duplicate-looking timestamps, and 16 apparent gaps of 2 seconds where a sample should have landed.
What we discovered: Both were artifacts of how the timestamp was displayed (rounded to the nearest second), not the underlying sampling clock (which recorded to the millisecond). Every sample was correctly and evenly spaced. Zero real data loss.
Why it matters: This sounds like housekeeping, but it set the rule for everything that followed: an anomaly gets investigated to its root cause before it's allowed to change a conclusion — not explained away, not silently dropped. That rule is what caught every reversal below.
Reversal #1: the outlier that wasn't real
What we tested: A larger model (llama3.1:8b) under the same conditions, to compare against the smaller model's throughput — how many tokens per second the system could generate.
What initially appeared to be true: One run showed a dramatic slowdown — a single request took 564.8 seconds, roughly six times longer than every other request in the run, dragging measured throughput down to 4.3 tokens per second. That made the larger model look 8.3× slower than the smaller one, and the run also showed data collection gaps and a failure to release GPU memory afterward.
What we discovered: We reran the identical test, byte-for-byte, to check reproducibility — the standard check for whether a one-time result reflects the system or reflects a fluke. The stall did not reproduce. Not partially — completely absent. The rerun completed more requests, with essentially complete data collection, and released memory exactly on schedule. Once the stalled request is set aside, the larger model's real throughput was roughly 5–6× slower than the smaller model, not 8.3×.
| Original run | Exact rerun | |
|---|---|---|
| Slowest single request | 564.8 s (~6× the others) | 118.5 s (normal cold-load overhead) |
| Measured throughput | 4.3 tok/s | 6.86 tok/s |
| Throughput vs. 3B model | 8.3× slower | ~5–6× slower |
| Samples collected | 2,001 of ~2,400 (83%) | 2,398 of ~2,400 (essentially complete) |
| Model unloaded cleanly? | No | Yes, on schedule |
Why it matters: For infrastructure decisions: a single benchmark run, however dramatic, is not evidence about your hardware — it's evidence about that one run. If a number is going to justify a purchase or a pricing decision, it needs a second, independent run before it's trusted. We never identified the exact cause of the original stall (a scheduling or resource-contention hiccup was the leading candidate), and we didn't need to — reproducibility, not explanation, was what settled the question.
Reversal #2: the metric was only watching half the machine
What we tested: How energy cost per token changes as more of a model's work is shifted from CPU to GPU — a setting called GPU offloading. A model's computation happens in layers; offloading means choosing how many of those layers run on the GPU versus the CPU. More GPU layers generally means faster generation, but also more GPU power draw.
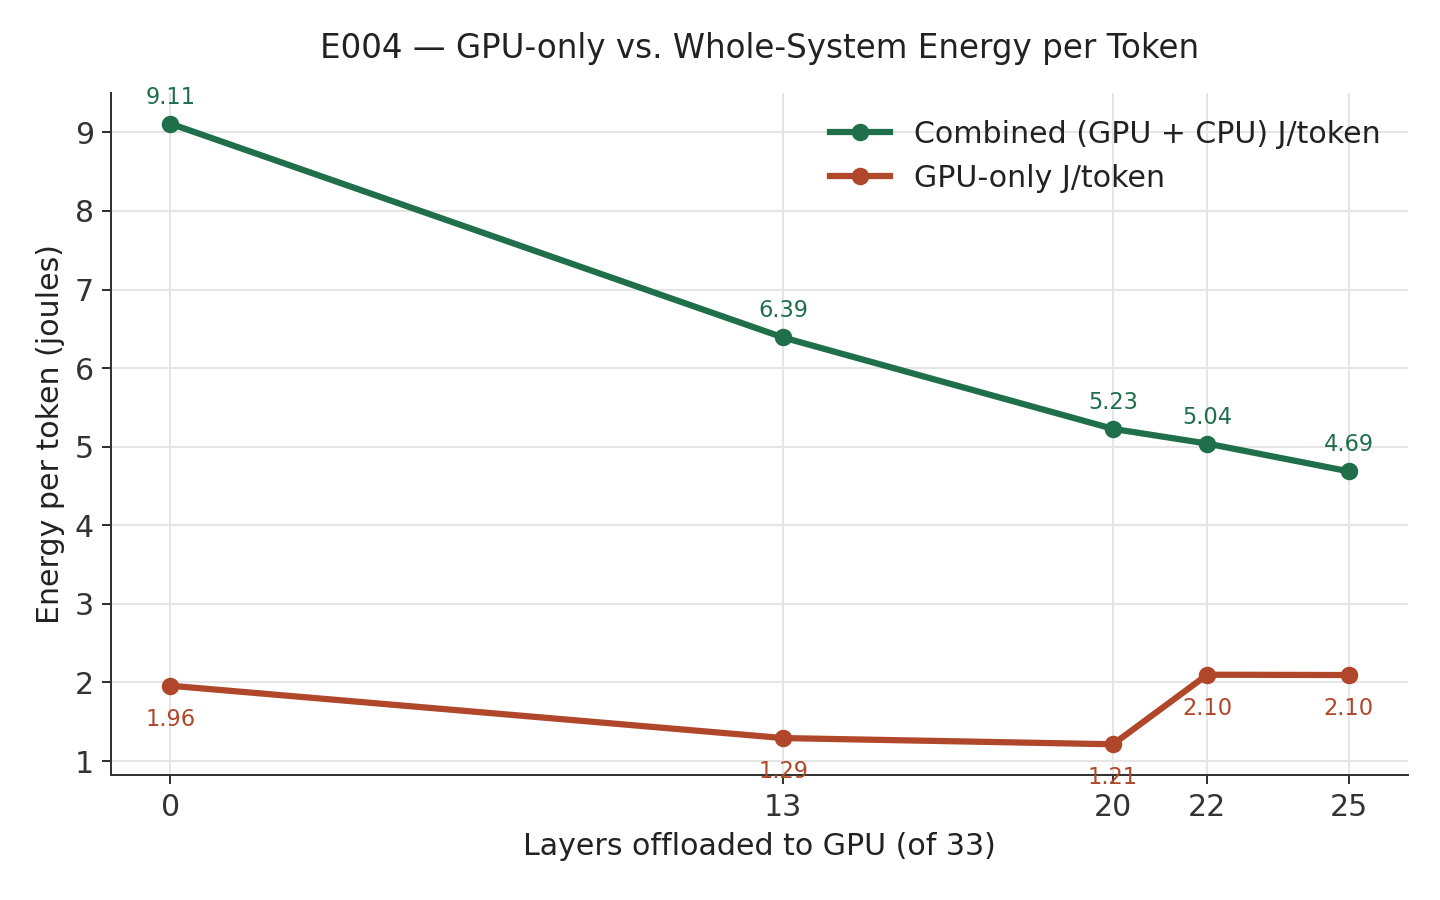
What initially appeared to be true: Measuring GPU power alone, energy per token (the electrical cost of generating one token of output) rose as more layers were offloaded to the GPU — 0.93 → 1.24 → 1.33 joules per token across three offload levels. The conclusion looked clean: more GPU offload, less efficient.
What we discovered: The layers that weren't on the GPU hadn't disappeared — they were running on the CPU, and nothing was measuring that cost. We instrumented real CPU power draw (via the processor's own built-in power telemetry) alongside the GPU reading. The combined, whole-system number told the opposite story: total energy per token fell steadily as GPU offload increased, from 9.11 down to 4.69 joules per token across five offload levels. More GPU offload wasn't less efficient — it was more efficient, once the CPU's real cost was actually counted instead of being invisible.
Why it matters: For cost estimation: if your energy or cost model only reads a GPU power sensor, it isn't an efficiency number — it's half of one, and the missing half can flip the sign of your conclusion. Before comparing hardware configurations on "efficiency," confirm what's actually being measured on both sides of the comparison.
Reversal #3: the finding didn't survive a hardware change
What we tested: Whether the offload-efficiency pattern from the laptop GPU (a 4GB card) held on very different hardware — a 24GB datacenter-class GPU (the NVIDIA L4), roughly six times the memory.
What initially appeared to be true: Nothing yet — this was the test of whether the previous finding was a property of LLM inference in general, or a property of that one GPU.
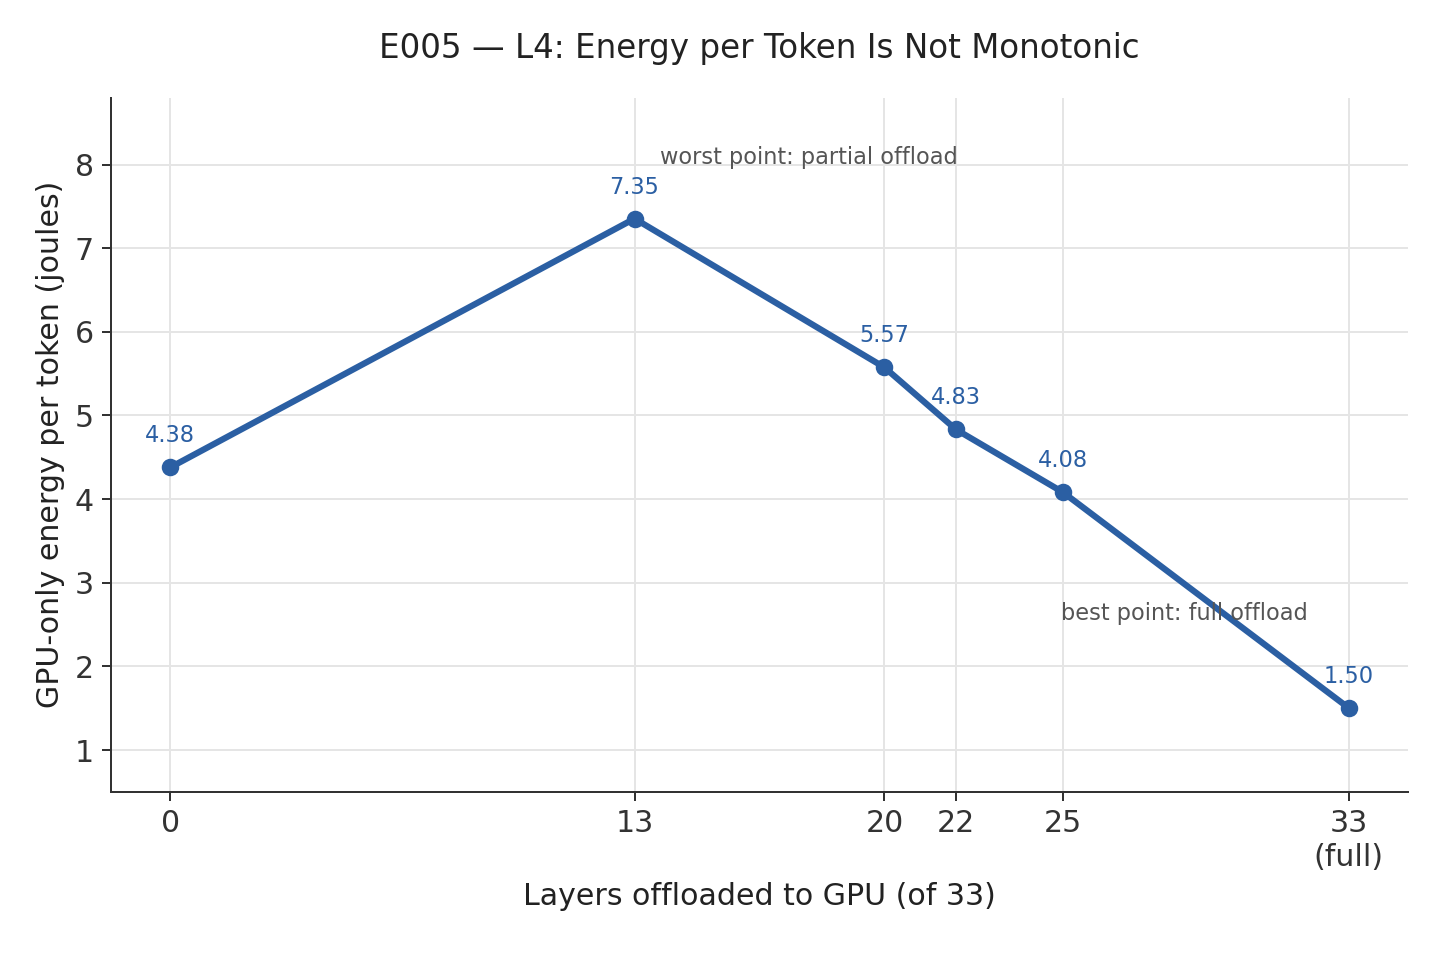
What we discovered: It didn't generalize. On the L4, energy per token followed neither a rising nor a falling line — it rose from 0 to a partial offload point, then fell all the way through to full offload: 4.38 → 7.35 → 5.57 → 4.83 → 4.08 → 1.50 joules per token. The worst point (partial offload) cost nearly five times more per token than the best (full offload). And at matched, directly comparable offload settings, the 24GB datacenter card was 4–5× less energy-efficient per token than the 4GB laptop card doing the identical work.
The visible mechanism: at partial offload, the L4's GPU utilization — the percentage of time the GPU reports itself as busy — sat at just 3.97%. The GPU was mostly idle, waiting on the CPU to finish the other layers, while still drawing 35.5 watts just for being powered on. At full offload, utilization jumped to 95.9% and throughput increased nearly tenfold for only about double the power draw. A partially-loaded datacenter GPU, in this test, behaved mostly like an idle heater; a fully-loaded one was efficient.
This run also surfaced a comparison trap: Ollama's "automatic" offload setting isn't a fixed configuration — it resolves differently depending on how much GPU memory is available. On the 4GB card, automatic meant roughly a third of the model's layers on GPU. On the 24GB card, automatic meant the entire model. Two experiments' "automatic" results looked comparable side by side and were not measuring the same setting at all.
Why it matters: For hardware selection: a bigger, more expensive GPU is not automatically the more efficient choice — its idle power draw and how well a given workload actually occupies it both matter as much as its raw capability. An efficiency curve measured on one GPU is a property of that GPU (and the CPU paired with it), not a law of LLM inference. Don't extrapolate a hardware conclusion across a hardware change you haven't tested. And when comparing "automatic" settings across systems, confirm what each system's automatic setting actually resolved to before treating the comparison as apples-to-apples.
Reversal #4: the "no headroom" number was measuring the wrong thing
What we tested: Whether increasing concurrency — the number of requests the GPU processes at the same time, rather than one after another — could meaningfully reduce cost per token on the same L4 deployment.
What initially appeared to be true: The previous experiment had already measured this same deployment at 95.93% GPU utilization running one request at a time. Read at face value, that number suggests the GPU is nearly maxed out, with little room for concurrency to help.
What we discovered: It wasn't close to true. Raising concurrency from 1 to 8 simultaneous requests cut effective cost per token by roughly 4.8×, from $4.11 to $0.86 per million tokens, with no sign of leveling off at the highest setting tested. GPU power draw, meanwhile, stayed essentially flat across every concurrency level — about 71 watts whether one request or eight were in flight.
| Concurrency | Cost per million tokens | GPU power | GPU utilization |
|---|---|---|---|
| 1 | $4.11 | 71.7 W | 96.1% |
| 2 | $2.26 | 71.6 W | 93.5% |
| 4 | $1.59 | 71.8 W | 90.9% |
| 8 | $0.86 | 71.2 W | 84.3% |
The result even ran slightly counter-intuitively: reported utilization declined somewhat as concurrency rose, even as real cost efficiency improved sharply. Aggregate throughput scaled from about 48 to 229 tokens per second — nearly 4.8× — on essentially the same power draw the whole time.
The most likely explanation is that single-request decoding on this GPU was memory-bandwidth-bound — spending much of its "active" time moving data rather than computing, time that a utilization reading counts as busy regardless of what the GPU is actually accomplishing during it. Batching multiple requests together appears to let otherwise-idle compute capacity do useful work for a different request's tokens, raising real throughput per watt without raising watts. We want to be precise here: this is the interpretation the data are consistent with, not a mechanism we isolated and proved directly — we did not, for instance, profile the GPU at the kernel level to confirm the bandwidth bottleneck. What we did measure directly and repeatedly is the outcome: utilization stayed high while efficiency, measured in real dollars, improved substantially.
Why it matters: For monitoring and capacity planning: "the GPU shows 96% utilization" answers "is something running on the GPU right now." It does not answer "how much more efficient could this deployment get." Treating utilization as a stand-in for available headroom, on this kind of workload, would have led directly to leaving a 4.8× cost improvement on the table — available through a configuration change, with no new hardware involved.
What this means for infrastructure decisions
If you're the person deciding how to deploy or pay for private LLM inference, here's what these six experiments translate to directly:
When estimating cost per token: measure the whole system (GPU and CPU power together) under a workload that resembles your real traffic pattern. A GPU-only power reading is not a cost estimate — it's a partial one, and Reversal #2 shows it can point in the wrong direction entirely.
When selecting hardware: don't assume more GPU memory or a higher-tier card is automatically cheaper to run. Reversal #3 found a 24GB datacenter GPU running 4–5× less efficiently per token than a 4GB laptop card at matched settings. Test the actual pairing you intend to deploy, not a spec sheet comparison.
When reading monitoring dashboards: high GPU utilization does not mean you're out of headroom. Reversal #4 found a 4.8× cost improvement sitting behind a utilization number that looked nearly saturated. Before concluding you need more or bigger GPUs, test whether concurrency or batching configuration changes the picture first — it's cheaper to test than to provision.
When sizing capacity or comparing cloud vs. self-hosted options: benchmark under conditions that match production — concurrent, realistic traffic — not a single request run once. A one-off benchmark (Reversal #1) can misrepresent your real-world numbers by a wide margin in either direction.
When comparing configurations across systems: confirm that "automatic" or "default" settings actually resolved to the same configuration on each system before treating a comparison as fair. They may not (Reversal #3).
What's still open
Two questions are left deliberately unresolved — not gaps being glossed over, but the next experiments in this line of work.
Would the CPU-counted reversal from Reversal #2 also apply on the L4? The cloud environment used for the L4 experiments has no usable CPU power telemetry available, so that comparison hasn't been run yet. Whether whole-system efficiency on the L4 would still favor full offload, or whether the CPU-side picture changes things there too, is genuinely unknown.
Does the concurrency-cost curve from Reversal #4 keep falling past 8 simultaneous requests, or does it find a plateau? The test stopped at 8 deliberately, with the trend still improving and no sign of leveling off. Whether 16 or 32 concurrent requests continues the pattern is the natural next test.
Neither of these weakens what's already been shown. They're scoped as the next line of investigation, not caveats on the current one.
Conclusion
Across six experiments, every number we reported was real and correctly measured. None of them were wrong because of a measurement error. They were wrong, or misleading, because each one was true only for the slice of the system it was actually looking at — and something important was happening just outside that view every time.
If there's one habit worth taking from this series, it's this: before a metric changes a decision — a GPU purchase, a cost estimate, a capacity plan — ask what it isn't measuring, not just what it is. The number that looks most like an answer is exactly the one worth checking hardest.
Methodology
All experiments used open-weights models served via Ollama, with GPU telemetry sampled at approximately 1Hz via NVIDIA's monitoring interface (NVML). Where noted, CPU package power was measured via the processor's built-in power telemetry (RAPL), accessed through LibreHardwareMonitor; this was not available on the cloud GPU environment used for the L4 experiments.
- E001 (baseline, 3B model, laptop GPU): data-quality validation run, 2,398 samples over ~40 minutes.
- E002 / E002b (8B model, laptop GPU): original run and an exact, unmodified reproduction to test result stability.
- E003 / E004 (8B model, laptop GPU): GPU-only vs. combined GPU+CPU energy per token across five GPU-offload levels (0–25 of 33 layers); E004 was run as five single repetitions rather than paired reps, for reasons specific to running an 8B model's memory footprint on the same machine used to orchestrate the test — documented in that experiment's own appendix.
- E005 (8B model, NVIDIA L4, cloud): same offload-level design as E003, six conditions including full offload, 2 repetitions per condition (12 runs total), all reproducing within ~9% between reps.
- E006 (8B model, NVIDIA L4, cloud): concurrency test at 1, 2, 4, and 8 simultaneous requests, 2 repetitions per condition (8 runs total), reproducing within roughly 1% between reps — the tightest reproducibility of the series. Cost figures were computed from first-party GCP compute pricing divided by measured wall-clock throughput, not from nominal or estimated rates.
Full per-run data, processed CSVs, and provenance logs are retained for each experiment and available on request.
Related reading
Each reversal above has its own standalone deep-dive:
- We Ran the Same Benchmark Twice and Got a Different Answer — Reversal #1, in full
- Why We Didn't Upgrade to the Bigger GPU — Reversal #3, in full
- One Config Change Cut Our Inference Cost 4.8× — Reversal #4, in full
- Build vs. Buy for Private LLM Inference — what all of this means for a build-vs-buy decision